

Currency Hedging and the Brexit Vote
Posted: 1 July 2016
Last week's Brexit vote wrought havoc on financial markets, wiping out $3T in market value during a few short days. These drops were clear in headline markets like the FTSE 100, S&P 500, and British Pound which plummeted to its 31-year low against the US Dollar. For any investor in these markets, the return impact from these moves on your performance is clear. What about your currency hedging program? When dramatic moves in asset prices, currency exchange rates, and interest rate differentials intersect with a standard currency hedging program, the results are often unintuitive and surprising.
To examine the Brexit vote's currency hedging impact we simulated standard hedging programs for two common indices, the S&P 500 and the Barclays Sterling Corporate Bond Index, from the perspective of British and European investors, respectively for the month of June. With the standard currency hedging programs simulated here, we use one-month forward contracts to hedge 100% of the currency risk. To avoid over-trading we allow our hedge ratios (the ratio of the size of our hedge position to the size of the risk being hedged) to drift 2%, for the S&P 500 investment, and 0.5%, for the Barclays Sterling Bond investment, before we adjust our hedge back to 100%.
Hedged investors in these assets want to track the local return as closely as possible in their home currency. For instance, a British investor hedging the US Dollar risk in her S&P 500 position hopes to receive the same return as her US-based counterpart. These local returns form the benchmark for our simulations.
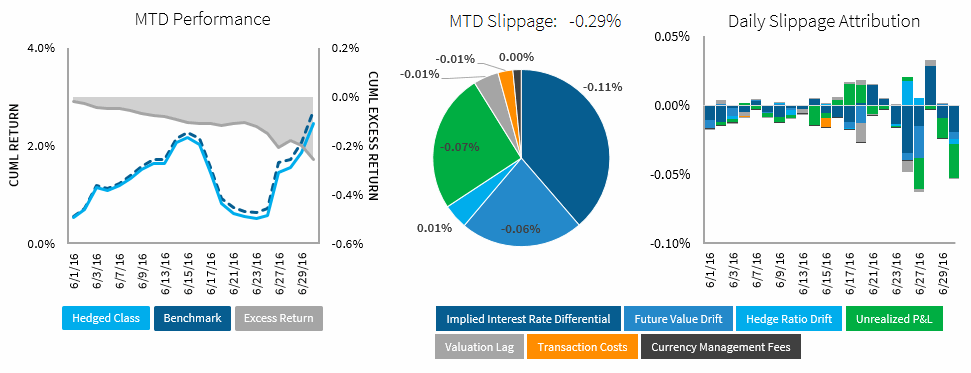
Barclays Sterling Corporate Bond Index
A European investor in the Barclays Sterling Corporate Bond Index, hedging their currency risk, would have lagged the local return by 0.29% during June, with nearly two-thirds of slippage occurring in the days following the Brexit vote. Attributing this performance each day, we identify the components driving this slippage. On 27 June, the slippage spikes mainly because of Future Value Drift and cash drag created by the Unrealized Profit on the hedges while the asset value rose. Unrealized Profit continues to be the leading contributor to slippage for the rest of June.
Future Value Drift
In Theory, The True Exposure To Currency Translation Risk Is The Future Value Of The Local Assets. However, It Is Impossible To Know With Certainty The Future Asset Value, Therefore Any Intra-Day Drift In Valuation Impacts The Effectiveness Of The Hedge
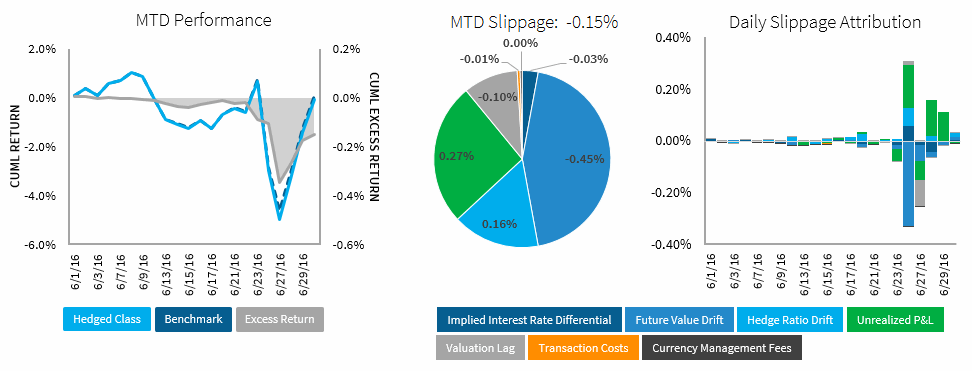
S&P 500
The S&P 500 ended June nearly flat for US-based investors and for British investors hedging their currency risk. This monthly outcome belies the underlying volatility since the Brexit vote. A British investor's currency hedged stake in the S&P 500 lagged behind its local return benchmark as much as 0.37% in the days after the Brexit vote. By examining the slippage components, we plainly see the significant impact from Future Value Drift as the index dropped away from the currency hedge positions the day after the vote. The most significant slippage contributor was Unrealized Profit and Loss. Cash drag from Unrealized Profit reduced slippage on 24 June, but once the full effects of the British Pound’s fall were accounted for by 27 June this swung to an Unrealized Loss and has dominated the other slippage contributors since. This amplified results as the S&P 500 suffered further losses then recovered, finally erasing most of the currency hedged investment's slippage since the vote.
Unrealized Profit & Loss: Unrealized Profit Or Loss On The Forward Contracts Can Act Like Drag Or Leverage On The Performance Of The Fund, Because It Is Not Invested In The Underlying Assets.
Both of the currency-hedged investments we simulated deviated from their benchmarks by significant amounts during the month, but under different circumstances. Rising asset values and cash drag led the hedged Barclays Sterling Corporate Bond Index to fall behind its improved value while the S&P 500 price swings, combined with the large currency move, luckily caused the hedged investment to finish the month level. These examples demonstrate the material slippage an event like the Brexit vote can have on an effective currency hedging program. We hope these simulations serve as guides for your currency hedging program performance during the Brexit. How did they do?
At Lumint, we believe detailed attribution analysis, like we previewed here, is critical to running and understanding currency hedging programs. If you are interested in seeing these analyses in greater detail or would like for us to evaluate your currency hedging program with a custom analysis, please email me at alex@lumint.com.
All market data sourced from Bloomberg.
Attribution factors derived from concepts in "Share Class Hedging: Performance Attribution", authored by J. Moore, J. Alexiev and D. Turkington, published in the Journal of Performance Measurement, Winter 2009.
Legal Disclaimer
This case study (“Study”) is for informational purposes only and does not constitute the provision of investment advice. This Study is solely intended for persons who are “eligible contract participants” and “qualified eligible persons” under CFTC regulations. Lumint does not accept customers who are not “eligible contract participants” and “qualified eligible persons." Nothing herein shall imply that information contained herein is correct as of any time subsequent to the date of this Study. This Study expresses no views as to the suitability of the products or strategies described herein for the reader of the Study or to the individual circumstances of such reader or otherwise.
This Study shows simulated results, not actual transaction results. Simulated results may be unreliable because they may reflect the application of hindsight. Simulated results should not be relied upon as an indication of future performance. Past performance, and in particular simulated results, is not a reliable indicator of and is no guarantee of future results. Returns may fluctuate with market conditions and every investment or strategy has the potential for loss as well as profit.
Certain information presented herein constitutes “forward-looking statements” which can be identified by the use of forward-looking terminology such as “may,” “will,” “should,” “expect,” “anticipate,” “project,” “continue” or “believe” or the negatives thereof or other variations thereon or comparable terminology. Any projections, market outlooks or estimates in this Study are forward-looking statements and are based upon certain assumptions. Due to various risks and uncertainties, actual market events, opportunities or results or strategies may differ materially from those reflected in or contemplated by such forward-looking statements and any such projections, outlooks or assumptions should not be construed to be indicative of the actual events which will occur.
The source for all figures included in this Study is Lumint, unless stated otherwise. While all the information prepared in this Study is believed to be accurate, Lumint may have relied on information obtained from third parties and makes no warranty as to the completeness or accuracy of information obtained from such third parties, nor can it accept responsibility for errors of such third parties.